The Ryzen 7 7800X3D and Intel’s Core i9 13900KS are high-performance CPUs, both achieving their excellence in different ways. We’ll examine the differences in architecture and gaming performance of the i9 13900KS vs Ryzen 7 7800X3D in the comparison below.
Key Takeaways
- The Ryzen 7 7800X3D had 8% better performance than the i9 13900KS in our gaming tests.
- The AMD CPU also consumed 25% less power than the i9 13900KS, with a power consumption of only 89 watts compared to the 118 watts of the i9.
- The 7800X3D is about 35% less expensive than the i9 13900KS at the time of writing this article, though the prices are subject to change.
Comparison Table
| Processor | AMD Ryzen 7 7800X3D | Intel Core i9 13900KS |
|---|---|---|
| Architecture | Zen 4 | Raptor Lake |
| Integrated Graphics | Yes | Yes |
| Socket | LGA-1700 | AM5 |
| Graphics Model | AMD Radeon™ Graphics | Intel UHD Graphics 770 |
| Launch | Q2’23 | Q1’23 |
| Best Motherboards | Motherboard For Ryzen 7 7800X3D | Motherboards For i9 13900KS |
| Best RAM | RAM For Ryzen 7 7800X3D | RAM For Core i9 13900KS |
| Best CPU Coolers | CPU Coolers For Ryzen 7 7800X3D | CPU Coolers For Core i9 13900KS |
Architectural Differences
- Process Nodes: The i9 13900KS uses a 10nm manufacturing process, whereas the Ryzen 7 7800X3D uses a 5nm manufacturing process. The more recent processing nodes on the Ryzen 7 7800X3D make it more power efficient.
- Core Count: The AMD Ryzen 7 7800X3D features a total of 8 cores and 16 threads, while the Intel Core i9 13900KS has a significantly higher core count of 24 cores (16 Efficiency cores and 8 Performance cores) and 32 threads.
- Clock Speeds: The AMD Ryzen 7 7800X3D has a base clock of 4.2GHz and can boost up to 5.0GHz. On the other hand, the Intel Core i9 13900KS has a base clock of 2.40GHz, but it can boost up to an impressive 5.40GHz.
- Memory: Both processors have support for high-capacity memory. The AMD Ryzen 7 7800X3D supports DDR5 memory technology with a maximum memory capacity of 128GB. On the other hand, the Intel Core i9 13900KS supports DDR4 and DDR5 memory, with a maximum memory capacity of 128GB.
- Cache: The AMD Ryzen 7 7800X3D features a larger L3 cache of 96MB, which can improve data access and overall performance. The Intel Core i9 13900KS has a smaller L3 cache of 32MB.
- TDP: The TDP (Thermal Design Power) of the AMD Ryzen 7 7800X3D is 120W, while the Intel Core i9 13900KS has a higher TDP of 253W.
Gaming Benchmarks
In this part of the Core i9 13900KS vs Ryzen 7 7800X3D comparison, we will see the difference in performance these processors have while gaming. To maximize the workload on the CPU, we decided to benchmark these chips on 1080p with high settings.
The test bench that accompanied these processors in our testing had the following components:
- OS – Windows 10 pro
- MOBO – MSI MEG X670E ACE
- MOBO – Asus ROG Strix Z790 – E Gaming
- COOLER – CORSAIR ICUE H150I ELITE
- GPU – Asus TUF Gaming RTX 4090 24GB
- RAM – XPG Lancer (2 x 16GB) 32GB RAM DDR5 5600Mhz
- SSD – WD Black SN850 NVMe SSD
- PSU: ENERMAX REVOLUTION D.F. X 1050W
Horizon Zero Dawn

- In the first game in our testing, the 7800X3D takes the lead over the much more expensive 13900KS. The Ryzem CPU averaged about 250 FPS, whereas the Intel CPU managed 213 FPS.
- The disparity in performance continues through the 1% lows, where the Ryzen maintains 193 FPS, whereas the i9 maintains 179 FPS.
Hitman 3

- In Hitman 3, the Ryzen 7 7800X3D achieved an average of 233 FPS, while the i9 13900KS reached a 222 FPS average. Once again, the Ryzen had significantly better performance.
- Both CPUs reported similar 1% lows during demanding gameplay sequences, with the Ryzen 7 at 175 FPS and the i9 at 168 FPS. This difference is noteworthy, though not noticeable.
Forza Horizon 5

- When we fired up Forza Horizon 5 on both processors, the Ryzen 7 achieved an average of 216 FPS, while the i9 reached 209 FPS. The performance difference seems smaller here as Forza is a well-optimized title, taking advantage of the tech on both CPUs.
- Both processors held their ground in the more demanding parts of our test, with the Ryzen 7 7800X3D at 178 FPS and the i9 13900KS at 172 FPS.
Cyberpunk 2077

- In our brief Cyberpunk 2077 benchmark, the Ryzen 7 7800X3D achieved an average of 155 FPS, while the i9 13900KS delivered a slightly higher average of 161 FPS.
- Both processors provided similar 1% lows, with the Ryzen at 140 FPS and the i9 at 136 FPS.
Far Cry 6

- The performance lead of the Ryzen 7 7800X3D was restored in Far Cry 6, with it achieving an average FPS of 196 FPS, surpassing the i9 13900KS with an average of 180 FPS.
- Both processors provided comparable 1% lows, with the Ryzen at 167 FPS and the i9 at 156 FPS. The difference in this game in terms of 1% lows is noticeable.
Assassin’s Creed Valhalla

- Assassin’s Creed Valhalla was no challenge for our processors with our accompanying components. The Ryzen 7 7800X3D achieved an average of 226 FPS, outperforming the i9 13900KS, which achieved an average of 212 FPS.
- The Ryzen CPU also delivered higher 1% lows, with 169 FPS compared to the i9’s 153 FPS.
God Of War

- For the final game in our testing, God Of War had one of the smallest performance deltas. The Ryzen had an average of 212 FPS, whereas the Core i9 13900KS kept up with an average of 210 FPS.
- 1% lows were vastly different in this title. The Ryzen 7 7800X3D had 1% lows of 183 FPS, whereas the i9 13900KS had 1% lows of around 101 FPS.
Productivity Benchmarks
We ran different benchmark tests using recognized software to obtain the productivity scores for the two CPUs.
PassMark

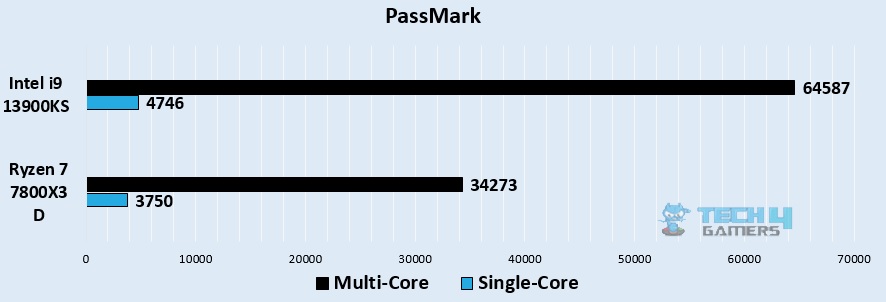
- The i9 13900KS had an impressive benchmark score of 4746 for single-thread performance. Unfortunately, the Ryzen 7 7800X3D lagged by 23.4% with a score of 3750.
- In the multi-thread comparison, we once again saw the i9 13900KS leading with 64587 points while the Ryzen 7 7800X3D could only score almost half the score, 34273.
CineBench R23

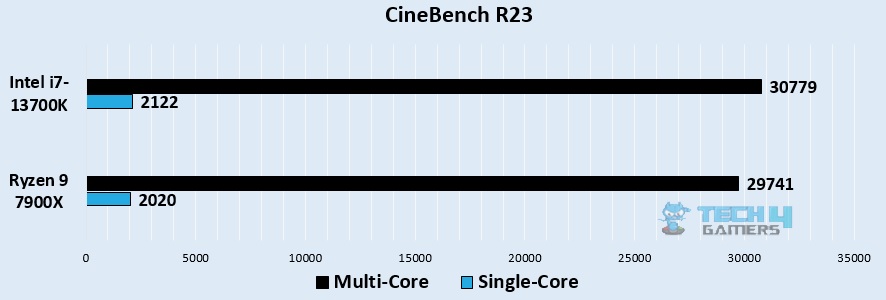
- Without a doubt, the i9 13900KS had a stunning score of 2314 for single-thread testing. Meanwhile, the Ryzen 7 7800X3D could only score 1782 points. It lost by 26%.
- For multi-core benchmarks, the i9 13900KS performed up to 40835 points. On the contrary, the Ryzen 7 7800X3D had a far lower score of 18190, a massive difference of 76.7%.
GeekBench v6

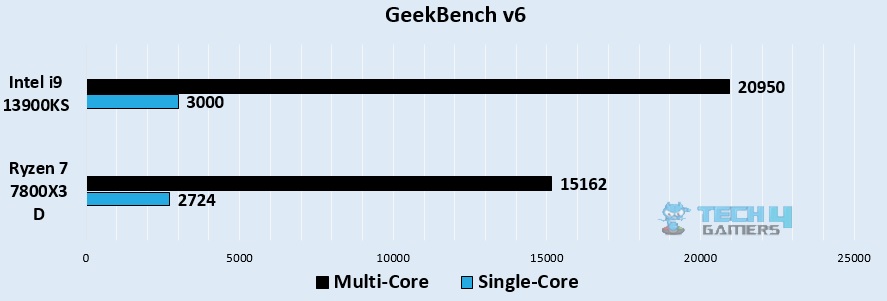
- In the third benchmark, the i9 13900KS scored 3000 in the single-core, and the Ryzen 7 7800X3D was behind by 9.6% with a score of 2724.
- The multi-core testing showed i9 13900KS leading by 32% with a total score of 20950. The Ryzen 7 7800X3D could score 15162.
Overall Performance
| Processor | Average FPS | 1% Lows | Productivity (Rating) |
|---|---|---|---|
| Core i9 13900KS | 📈200.1 | 📉153.1 | ✏️9/10 |
| Ryzen 7 7800X3D | 📈213.4 | 📉171.1 | ✏️4.9/10 |
| Winner: Ryzen 7 7800X3D |
Framerate
The Ryzen 7 7800X3D has an average framerate of about 214 FPS during our testing, while the Core i9 13900KS has an average framerate of about 201 FPS.
1% lows were also significantly improved on the Ryzen. It maintained a framerate of about 172 FPS during the tests, whereas the i9 had 1% lows of about 152 FPS. This might concur that the i9 will start giving choppy gaming performance earlier than its life cycle, as compared to the Ryzen.
Switching gears to performance per dollar, the Ryzen 7 absolutely demolishes the i9 with a 63% advantage. This means that the Ryzen 7 7800X3D is an example of the fringe case where the tech is better performant and much cheaper than the competition.
If you want to squeeze the most performance out of your hardware, take a look at our guide on overclocking.
Productivity
Undoubtedly, the i9 13900KS ranked top compared to the Ryzen 7 7800X3D in all three benchmark tests we ran. Whether we look at the single-core or multi-core performance, the Core i9 dominated the productivity scores by hefty margins.
Power Consumption

The Ryzen CPU consumed around 89 watts on average in the games we tested. Conversely, the i9 had a much higher power draw of approximately 118 watts.
These results prove that the Ryzen 7800X3D can perform markedly better than any given Intel CPU (In gaming scenarios) while consuming less power despite Intel’s efforts to minimize power draw.
The 33% higher power draw of the i9 means that you might need a new PSU to power this processor and get a higher power bill than you would with the Ryzen 7 7800X3D.
If we look at the performance per watt of these CPUs, the Ryzen 7 7800X3D has about 41% more performance per watt than the i9 13900KS, which cements its incredible architecture as being the way to go for modern processors focused on gaming.
Temperatures

In our tests, the i9 13900KS had an average peak temperature of 68°C. The Ryzen 7800X3D had an average peak temperature of around 69°C in our tests.
The temperature delta is not large enough to influence your buying decision, though it is important to note that both processors performed well within safe temperature margins during our tests.
Check out our guide on CPU temperatures while gaming to learn more about the safe thermal limits of most processors.
Price And Availability
Core i9 13900KS has an MSRP of $689, while the Ryzen 7 7800X3D is available for approximately $449, making the i9 about 53.5% more expensive, putting it in a completely different price segment.
Both CPUs are readily available and can be found in various computer parts stores, as well as on e-commerce platforms such as Amazon and Newegg.
What We Recommend
After all this discussion about the performance and features of both these processors, in this part of the Core i9 13900KS vs Ryzen 7 7800X3D comparison, we will look at the demographic for each of these processors.
The i9 13900KS has significant advantages over the Ryzen 7 7800X3D. Its higher core count makes it excel in multithreaded workloads, such as video editing and 3D rendering. It’s also overclocking-friendly, unlike the 7800X3D, which poses a risk to your motherboard with voltage adjustments.
Additionally, if we talk about productivity, the i9 13900KS leaves behind the Ryzen 7 7800X3D by a significant score difference. If your tasks align with these scenarios, the i9 13900KS is the better choice.
On the other hand, the Ryzen 7 7800X3D is recommended for most consumers. It delivers exceptional gaming performance, is more cost-effective, and consumes less power than the i9 13900KS. This makes it the top choice for gaming purposes.
Pros And Cons
| Core i9 13900KS | Ryzen 7 7800X3D | ||
| Pros | Cons | Pros | Cons |
| The large number of cores and threads allow this processor to be great for multithreaded workloads. | This processor performs inferior to the Ryzen 7 7800X3D even though it is a higher-tier product. | It beats the highest-tier offerings from Intel by a large margin while costing significantly less. | This processor is very sensitive to changes in voltages. |
| It has support for both DDR4 and DDR5 memory and a more accessible motherboard, lowering the platform cost. | The performance does not justify the price of this processor in gaming workloads. | The power consumption of this processor is so low compared to comparable offerings that it will return its value in savings if you use it for few years. | It does not perform as well as the 13900KS in multithreaded workloads. |
Frequently Asked Questions
Both processors were released within the span of the same year.
The 3D V-cache of the X3D processors is very sensitive to changes in voltages, and we cannot recommend messing with the voltages on the 7800X3D.
The Ryzen 7 7800X3D is a smarter pick for multi-tasking due to better performance and its ability to handle greater loads.
The Ryzen 7 7800X3D is more suitable for high-end calculations than the Core i9.
For most people, the Ryzen 7 7800X3D represents better value for gaming than the Core i9 13900KS.
More From Ryzen 7 7800X3D
More From Core i9 13900KS
Thank you! Please share your positive feedback. 🔋
How could we improve this post? Please Help us. 😔
Feedback By:
[Comparisons Expert]
Abdemanaf is a skilled creative writer who has been honing his craft since 2011. While initially working in different fields, he found a passion for technology and has been exploring the tech world since early 2015. Over the years, he has developed an in-depth knowledge of the latest tech trends and product offerings by various companies.
Abdemanaf’s writing reflects his analytical mindset and ability to think critically. He has a knack for breaking down complex technical information into easily digestible pieces, making his articles engaging and accessible to readers from all backgrounds. In February 2022, he joined Tech4Gamers as a blog and product comparison writer, where he has been able to hone his skills further.
As a writer, Abdemanaf is dedicated to staying up-to-date with the latest technological advancements and trends, enabling him to provide readers with the most relevant and accurate information. He is always eager to learn more and is constantly seeking new challenges to improve his skills.
Get In Touch: manaf@old.tech4gamers.com
 Threads


![Ryzen 7 5800X Vs Ryzen 7 5700G [Tested In AAA Games] Ryzen 7 5800X Vs Ryzen 7 5700G](https://old.tech4gamers.com/wp-content/uploads/2022/11/Ryzen-7-5800X-Vs-Ryzen-7-5700G-218x150.jpg)


